Assessing the impact of the new Gotthard Base Tunnel
The Gotthard Base Tunnel was opened in 2016. The Swiss Federal Office for Spatial Development launched a project to assess the initial impact of the new railway infrastructure on passenger and freight transportation as well as on the economies and settlement patterns in the region. EBP teamed up with consulting firm INFRAS and the Swiss engineering firm Brugnoli e Gottardi to answer the brief. A large interdisciplinary team defined 33 indicators, collected and processed the data needed and developed a monitoring concept. To efficiently create visualisations for all the data a dynamic visualisation tool was developed. I had the pleasure to create a visualisation concept for all the visual components throughout the project as well as some customised data visualisations for synthesis.
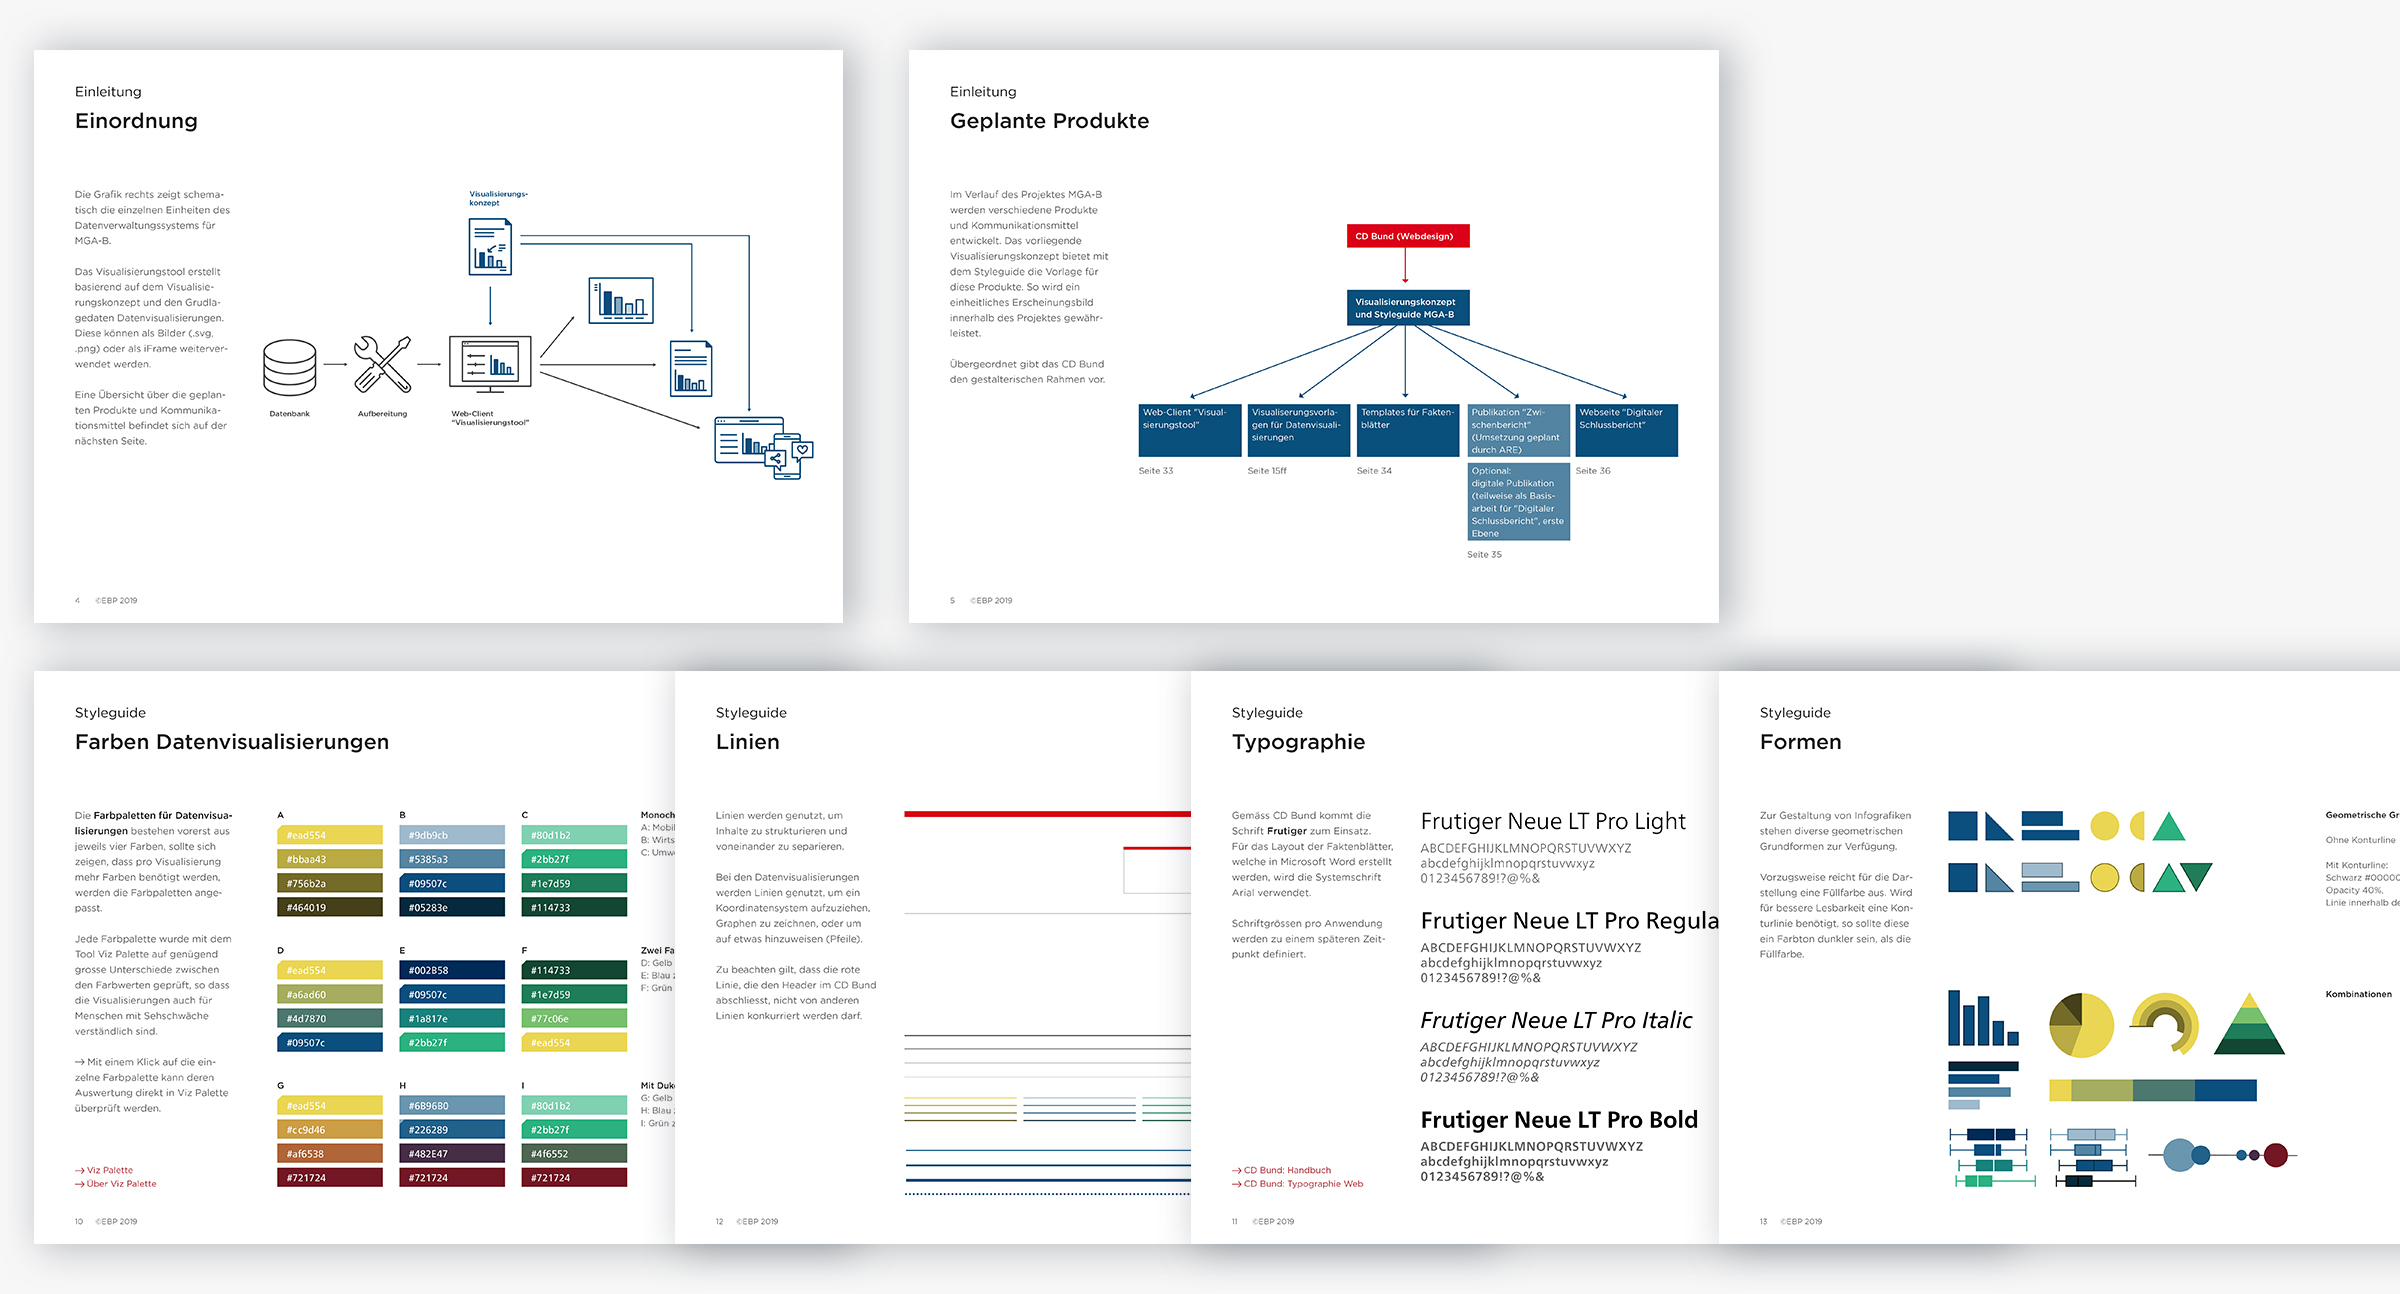
↑ The visualization concept defines visual components and their application throughout the project.
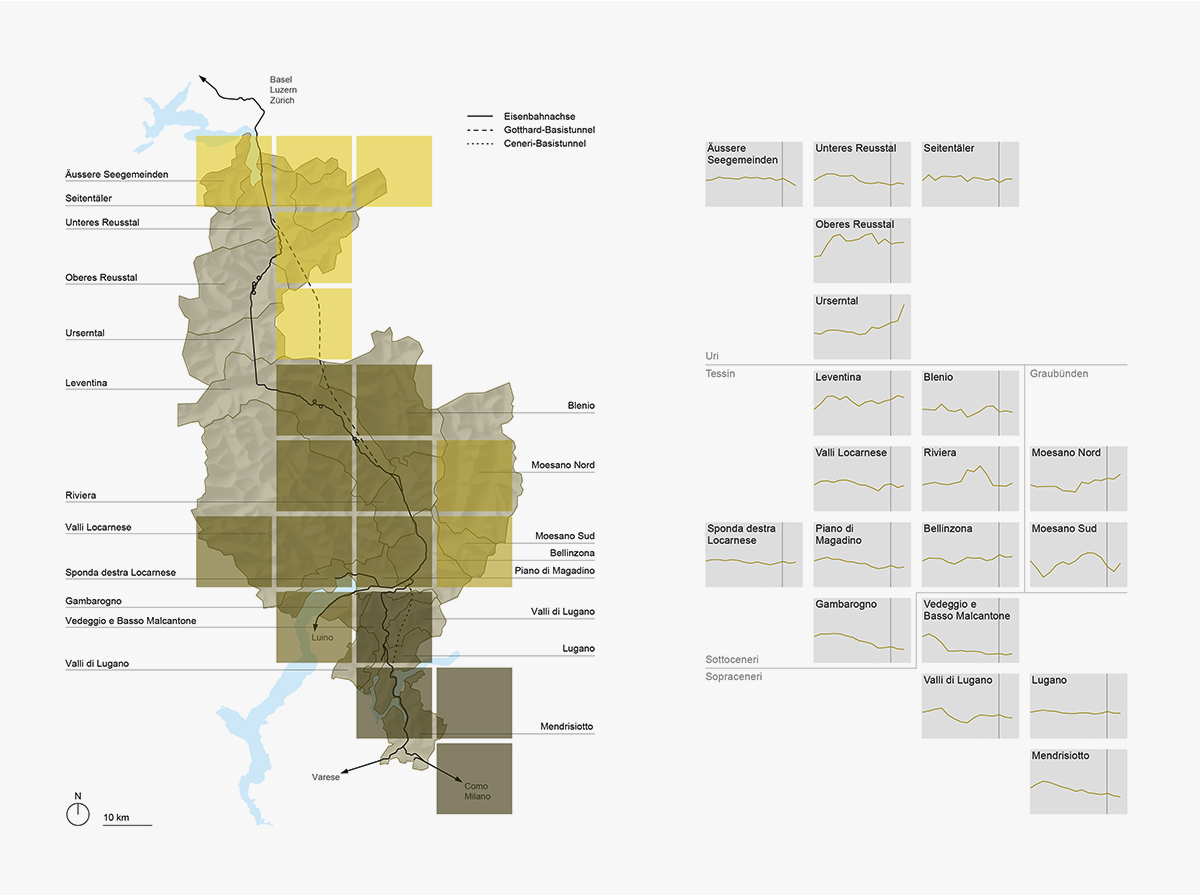
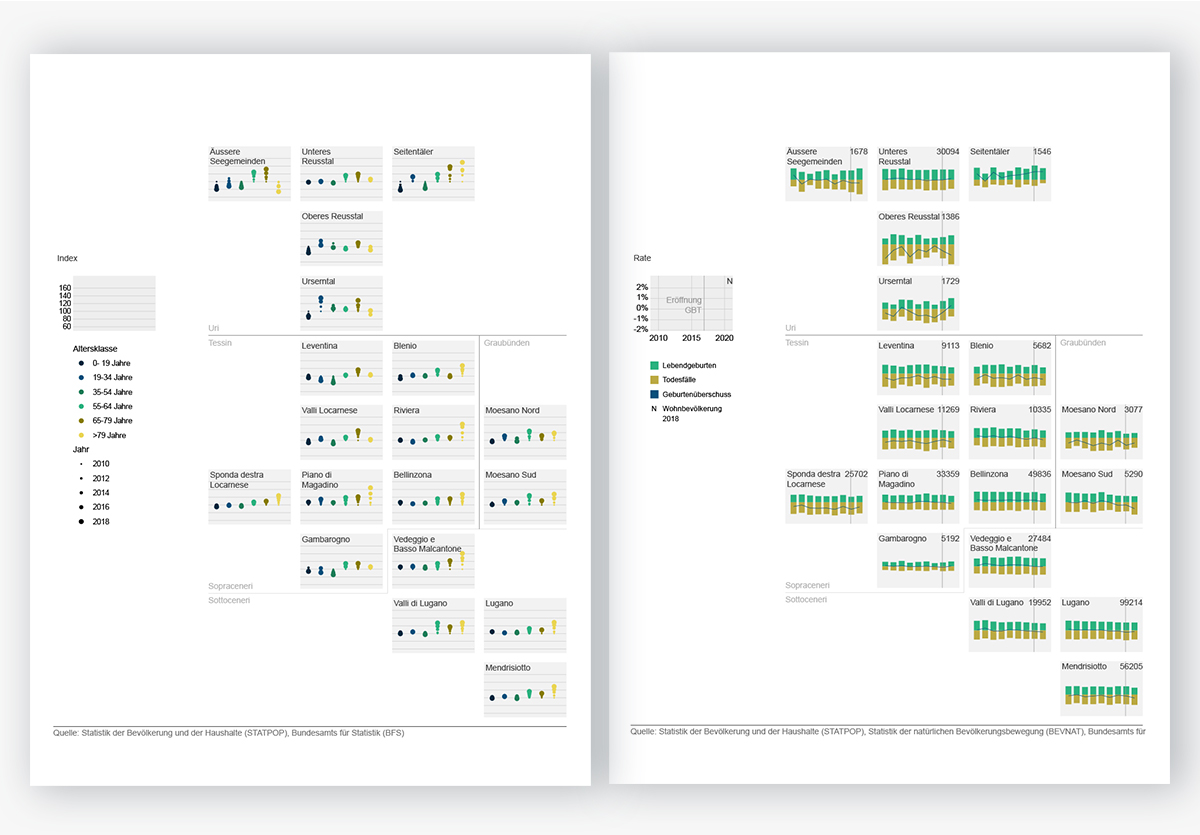
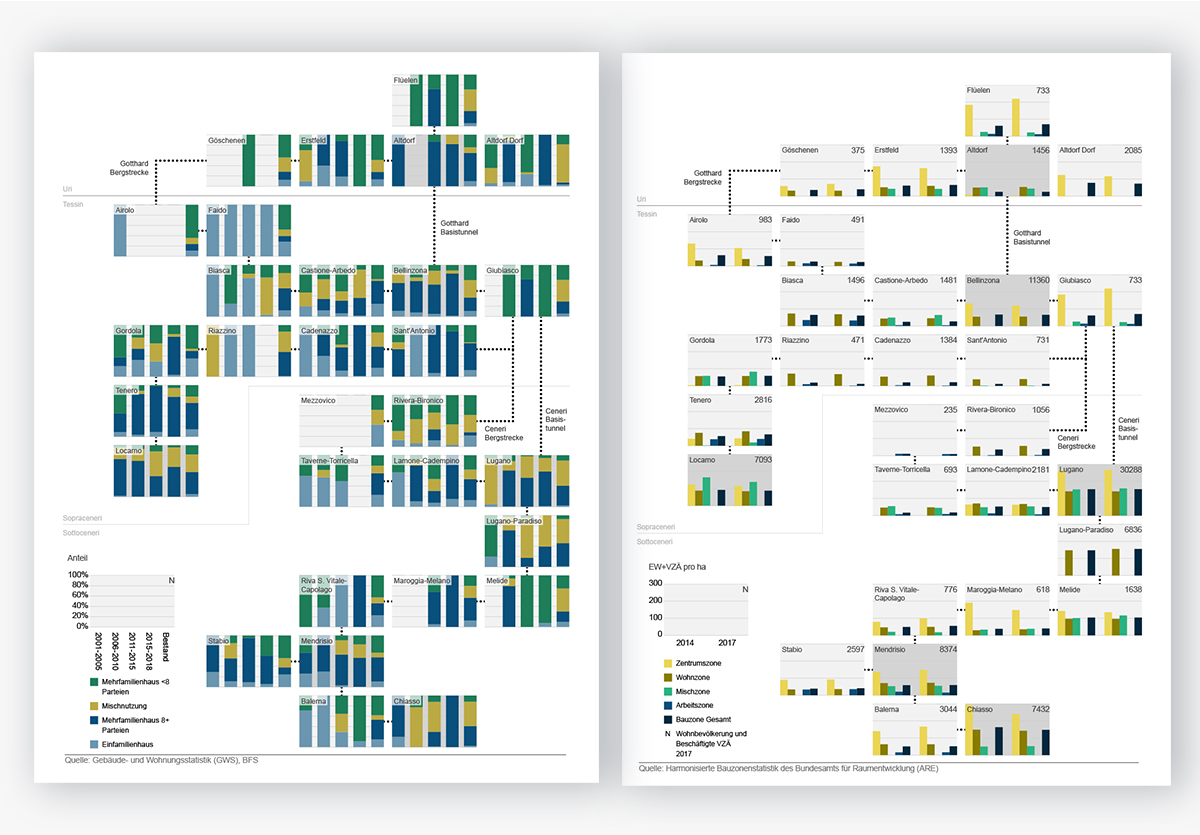
↑ Tile maps are a nice way to present and compare data for a geographical region. For this project two different tile maps were created: Geographical regions (left) and staitions along the railway (right)
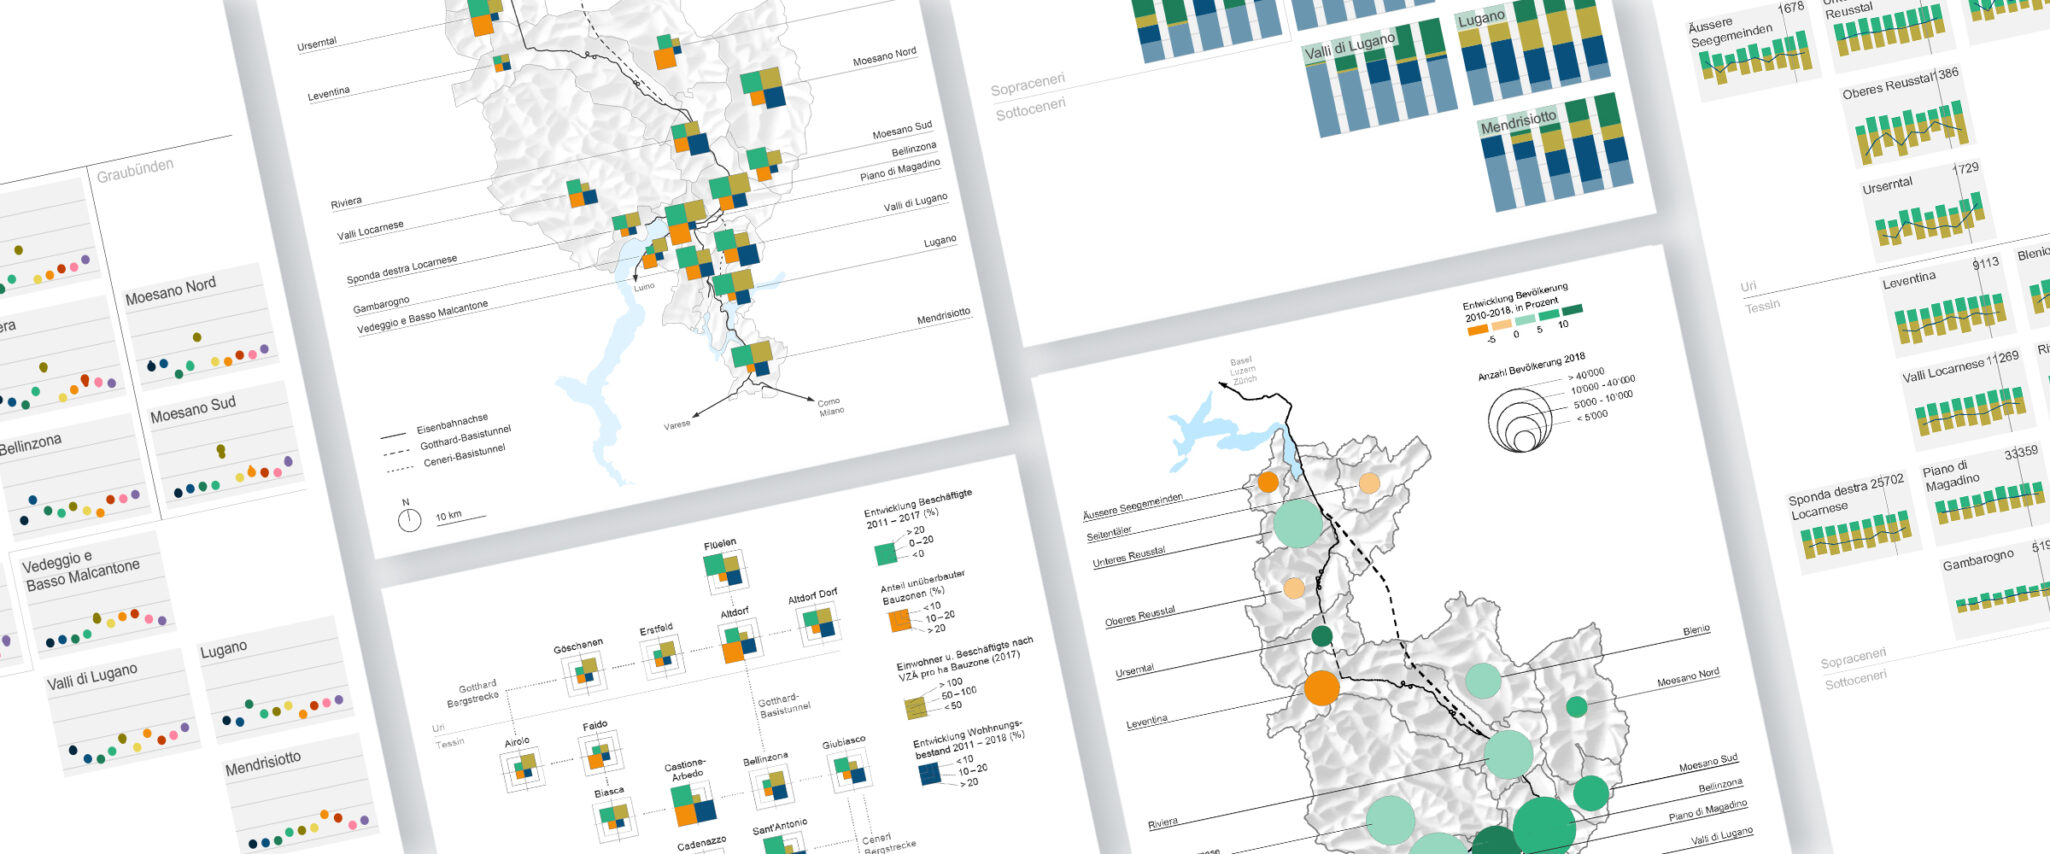
↑ The tile maps can basically be filled with any kind of visual representation.
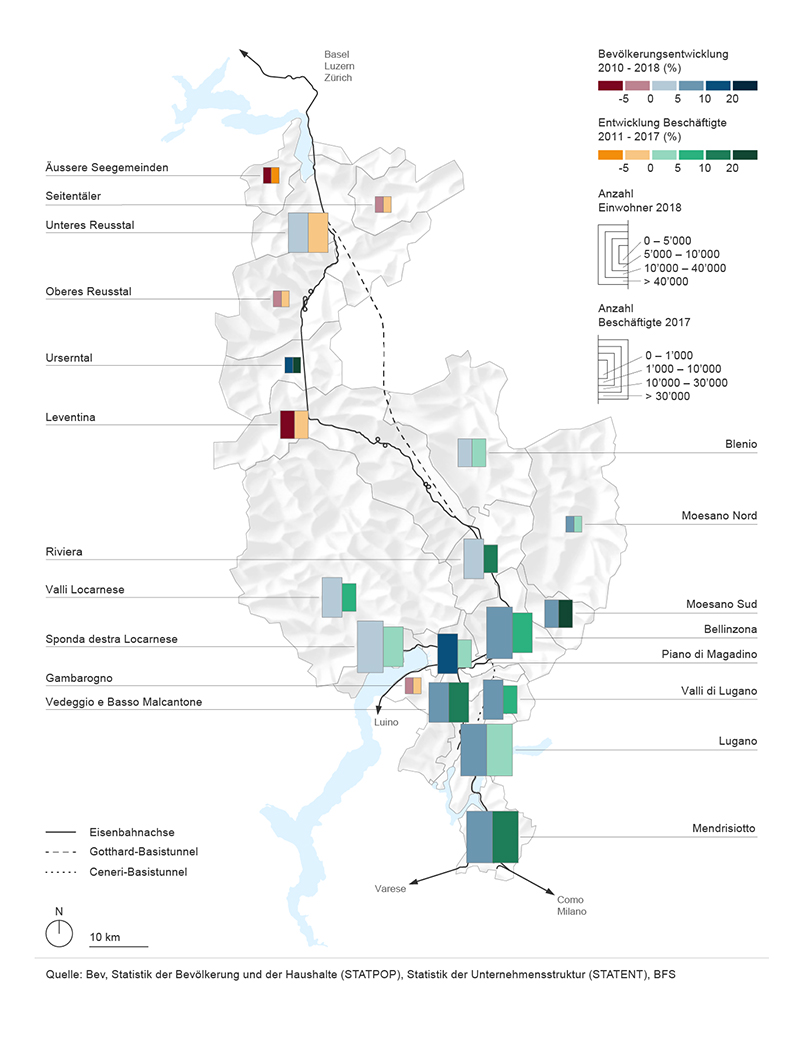
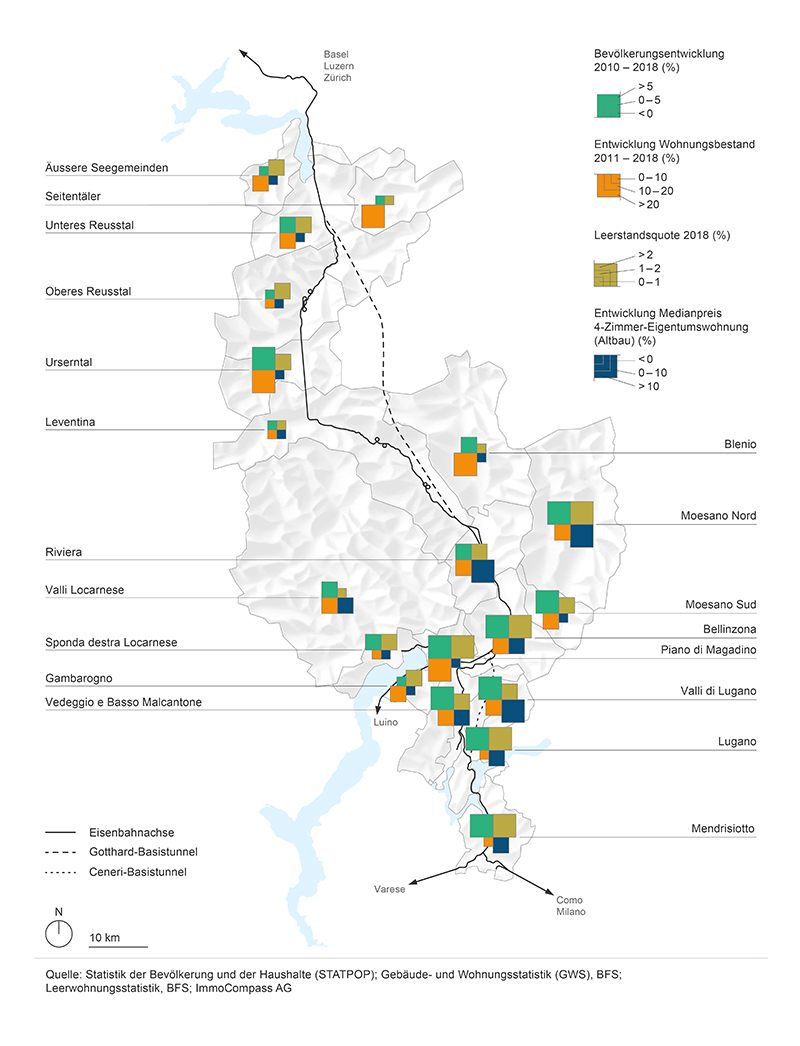
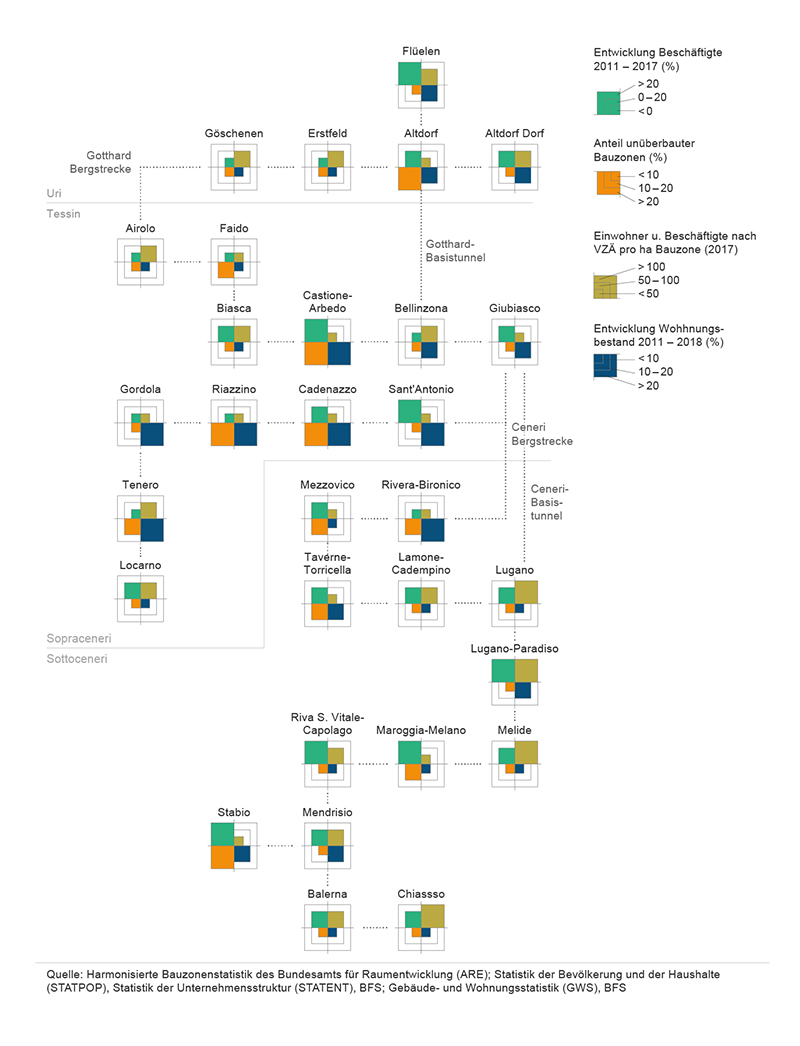
↑ Some topics needed a visualisation with a combination of indicators. These visualisations were handcrafted in Illustrator.